RTP vs Volatility in Slots: Expected Loss, Win Size and Bankroll Risk
Article OverviewRTP measures a slot's theoretical long-term return, while volatility describes how widely its payouts can vary. Three mathematical examples show why identical RTP percentages can produce very different short-session losses and bankroll swings.
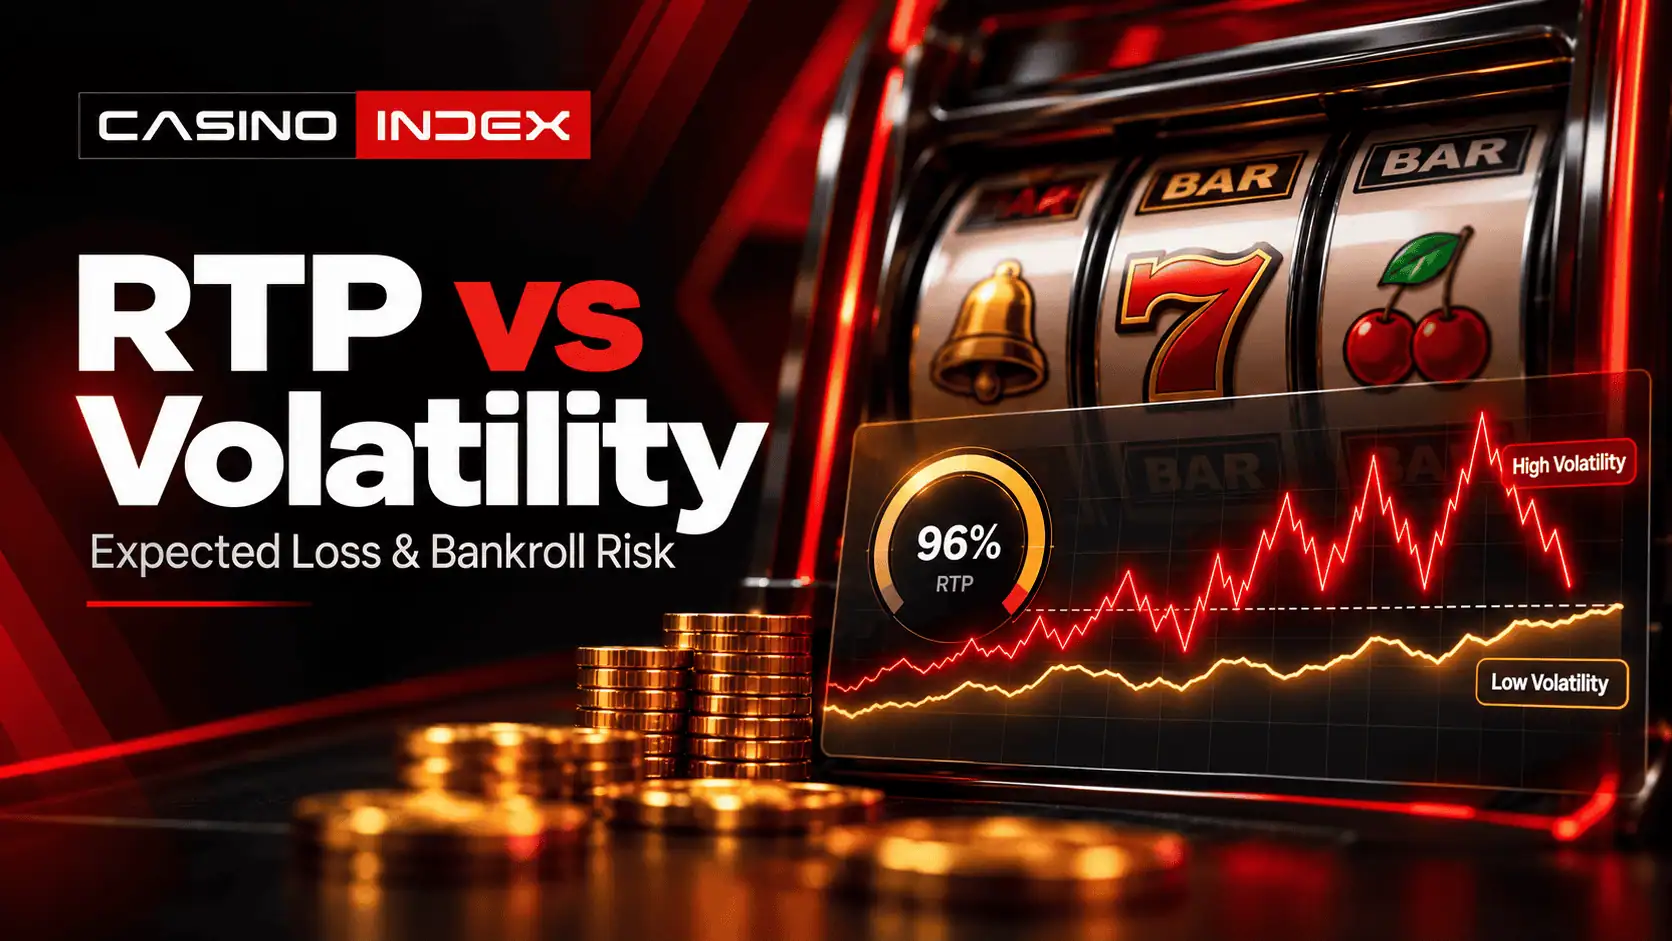
Two slots can advertise a 96% return to player (RTP) and still produce very different results over 100 spins. One might return small amounts frequently. Another might pay almost nothing until a rare, much larger prize appears.
The difference is RTP and volatility. RTP describes the theoretical share of total wagers a game pays back over the long run. Volatility describes how widely its payouts vary. Together, they explain why two games with the same mathematical average can place very different pressure on a limited bankroll.
Quick answer: RTP affects long-run expected loss. Volatility affects the spread of possible results and short-term balance swings. Neither predicts whether your next spin or session will win.
RTP vs Volatility: The Difference in One Table
| Measure | What it actually tells you |
|---|---|
| RTP | The theoretical percentage of all money wagered that returns as prizes over the long run. It does not predict an individual session. |
| Volatility | How widely payouts vary around their average. It does not identify when a large prize will arrive. |
| Hit frequency | How often a qualifying payout occurs. A payout can still be smaller than the original stake. |
| Maximum win | The highest possible payout under the stated game rules. It does not reveal the chance of achieving it. |
| House edge | The theoretical mathematical advantage retained by the casino. It does not determine the size of a short-session loss. |
For example, a $1 spin on a 96% RTP slot has an average theoretical payout of $0.96. However, the payout from one actual spin could be $0, a small amount, or substantially more than $1.
What RTP Measures—and What It Cannot Tell You
Return to Player measures a game’s theoretical average payout as a percentage of stakes. A 96% RTP corresponds to a 4% theoretical house edge when both percentages use the same wagering basis.
For fixed-stake slots, the basic calculation is straightforward:
Expected loss = total turnover × (1 − RTP ÷ 100)
Suppose you complete 200 spins at $1 each. Your turnover is $200. At 96% RTP, the theoretical expected loss is $200 × 0.04 = $8. At 94% RTP, it rises to $12.
These figures are averages across possible outcomes, not invoices from the casino. You could finish a real session in profit, lose far more than $8, or recover only a fraction of your stakes. RTP alone cannot tell you which outcome will occur.
Turnover Is Not the Same as Your Deposit
A $100 deposit does not necessarily mean $100 in total wagering. If you reuse winnings, the same money can fund multiple spins. As a result, total turnover may substantially exceed the original deposit.
See how casino RTP is calculated for the wider methodology.
Theoretical RTP Is Not Your Observed Return
Theoretical RTP comes from the game’s mathematical design. Observed RTP is calculated from the actual prizes and turnover recorded in a particular sample. Small samples can differ substantially from the theoretical figure, especially in volatile games.
Therefore, a losing evening does not prove that a game’s published RTP is false.
What Does Volatility Mean in Slots?
Volatility describes the spread of a slot’s possible payouts around the average. A lower-volatility model generally concentrates more of its return in relatively modest outcomes. A higher-volatility model typically has a wider payout distribution, sometimes relying heavily on rare, large prizes.
Imagine two 96% RTP games. Both have the same theoretical cost over equal turnover. Yet one might deliver numerous partial returns while the other produces long stretches without a meaningful payout.
Importantly, low volatility does not guarantee frequent profitable spins. Nor does high volatility guarantee a massive win.
Why Provider Volatility Labels Require Caution
Developers may classify games as Low, Medium, High or Very High volatility. Others use stars, points or numerical scales. However, these labels are not standardized across all slot providers.
Some developers also publish only a general label instead of a formal volatility statistic.
Treat an unexplained label as a general description, not a bankroll forecast.
Volatility vs Variance, Hit Frequency and Maximum Win
Variance and Standard Deviation
People often use volatility and variance interchangeably. Statistically, variance measures the average squared distance of possible payouts from their mean. Standard deviation is the square root of variance and expresses that spread in the same units as the payouts.
A larger standard deviation indicates a wider payout spread. Still, one number cannot describe the entire probability distribution. Two games can have similar standard deviations but different payout sizes, hit frequencies and bonus structures.
Hit Frequency Counts Payouts, Not Necessarily Profitable Spins
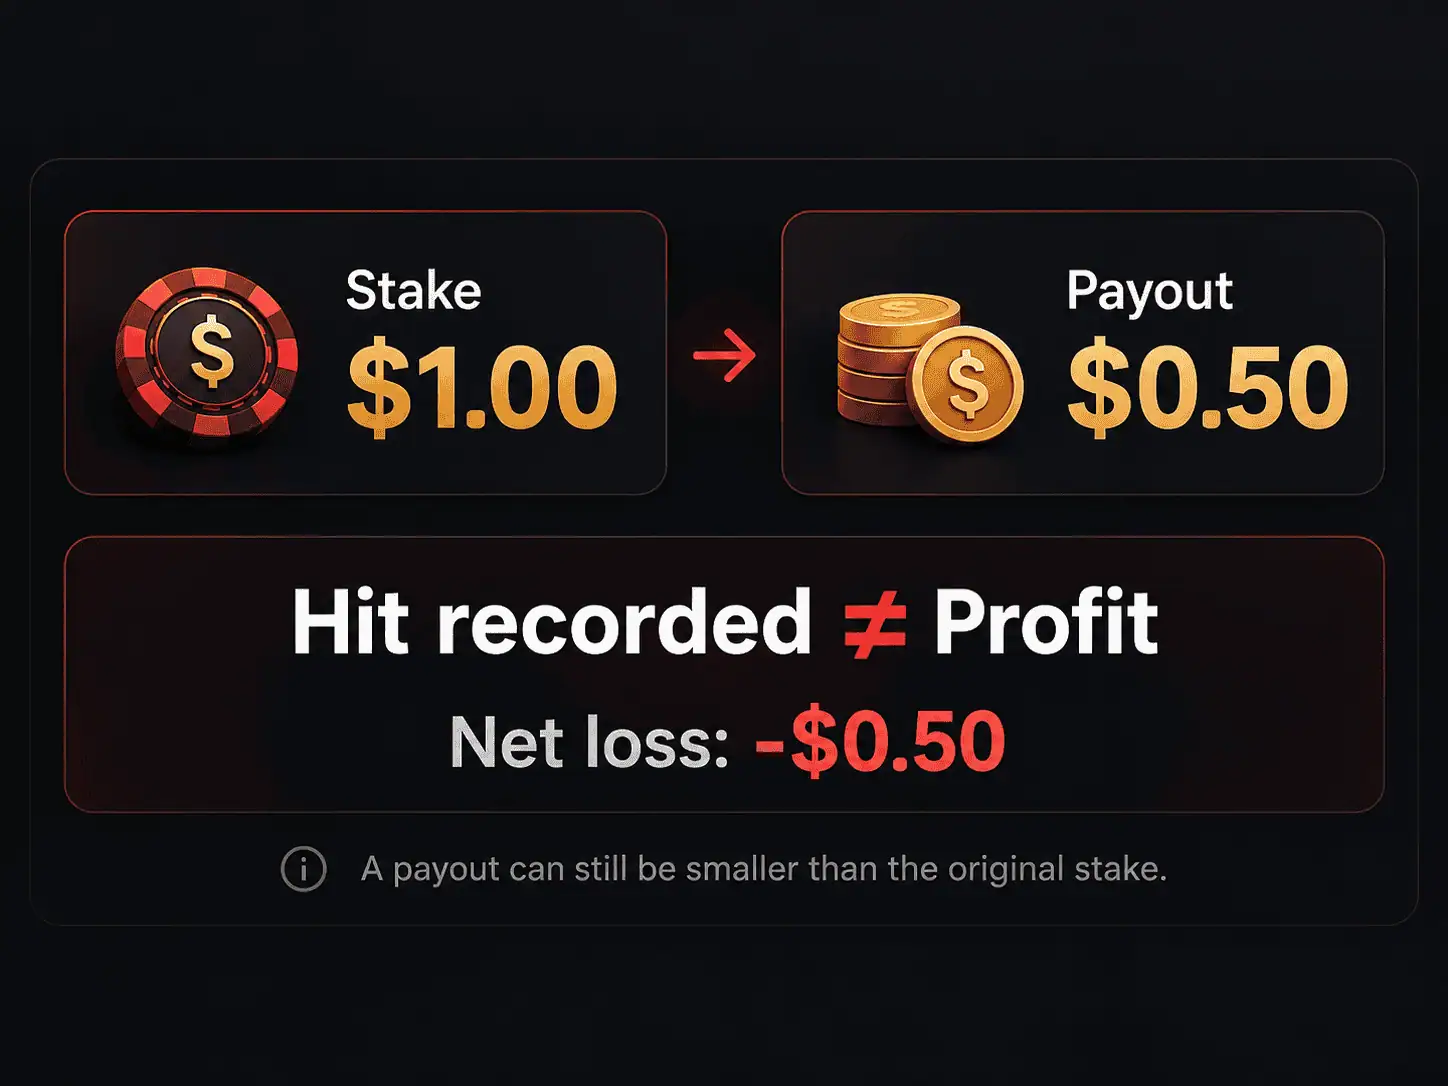
Hit frequency measures the proportion of rounds that produce a qualifying payout under the developer’s definition. Suppose a $1 spin returns $0.50. The slot has paid something, but the player has still lost $0.50 on that spin.
Consequently, a game can show regular winning animations while repeatedly returning less than the amount wagered. Hit frequency should not be presented as the probability of finishing a session ahead.
Maximum Win Is a Ceiling, Not a Probability
A headline maximum win of 5,000 times the stake tells you the possible payout ceiling under specific rules. It does not tell you how often that result occurs or what share of the RTP depends on very rare prizes.
Likewise, bonus-trigger frequency describes the chance of entering a particular feature, not the chance of earning a net profit.
Three Worked Examples: Same Stake, Different RTP and Volatility
The examples below use complete, simplified probability models, so every percentage can be checked.
Shared assumptions: Every spin costs $1; 100 spins create $100 in turnover; each spin is independent; all quoted payouts include the returned stake, if any; and the player has enough funds to complete all 100 spins. These are hypothetical models, not real casino titles or playing tests.
Example A: 96% RTP With Lower Volatility
Suppose Slot A has the following payout distribution for each $1 spin:
- 40% probability of receiving $0.
- 40% probability of receiving $0.50.
- 20% probability of receiving $3.80.
Its average payout per spin is (0.40 × $0) + (0.40 × $0.50) + (0.20 × $3.80) = $0.96.
Over $100 in fixed turnover, the expected payout is $96 and the expected loss is $4. The model pays something on 60% of spins. Nevertheless, the $0.50 outcome is still a losing spin, not a $0.50 profit.
Example B: 96% RTP With Much Higher Volatility
Slot B keeps the same $1 stake and 96% RTP but changes the distribution:
- 80% probability of receiving $0.
- 19% probability of receiving $0.50.
- 1% probability of receiving $86.50.
The average is (0.80 × $0) + (0.19 × $0.50) + (0.01 × $86.50) = $0.96 per spin. Therefore, the expected loss across 100 completed spins is still $4.
However, that return is unevenly distributed. The rare $86.50 prize accounts for $0.865 of the $0.96 expected payout per spin. In other words, most of the model’s theoretical return depends on an outcome that occurs on only 1% of spins.
Across 100 independent spins, the chance of not receiving that prize is 0.99100 ≈ 36.6%. If the prize never appears, each of those 100 spins pays at most $0.50. Total payouts cannot exceed $50, so the session loses at least $50 despite the 96% theoretical RTP.
That 36.6% figure applies only to this invented model. It is not a general probability for real high-volatility slots. Also, a long losing run does not make the next spin more likely to hit: each independent spin retains its original probability.
Example C: 94% RTP With Lower Volatility
Slot C follows a pattern similar to Slot A but has a lower theoretical return:
- 40% probability of receiving $0.
- 40% probability of receiving $0.50.
- 20% probability of receiving $3.70.
Its average payout is (0.40 × $0) + (0.40 × $0.50) + (0.20 × $3.70) = $0.94. Across 100 completed spins, the expected payout is $94 and the expected loss is $6.
This game has a relatively concentrated payout distribution, yet it costs more in theoretical expected value than Slot A. A smoother pattern does not cancel out the lower RTP.
What Changes—and What Stays the Same?
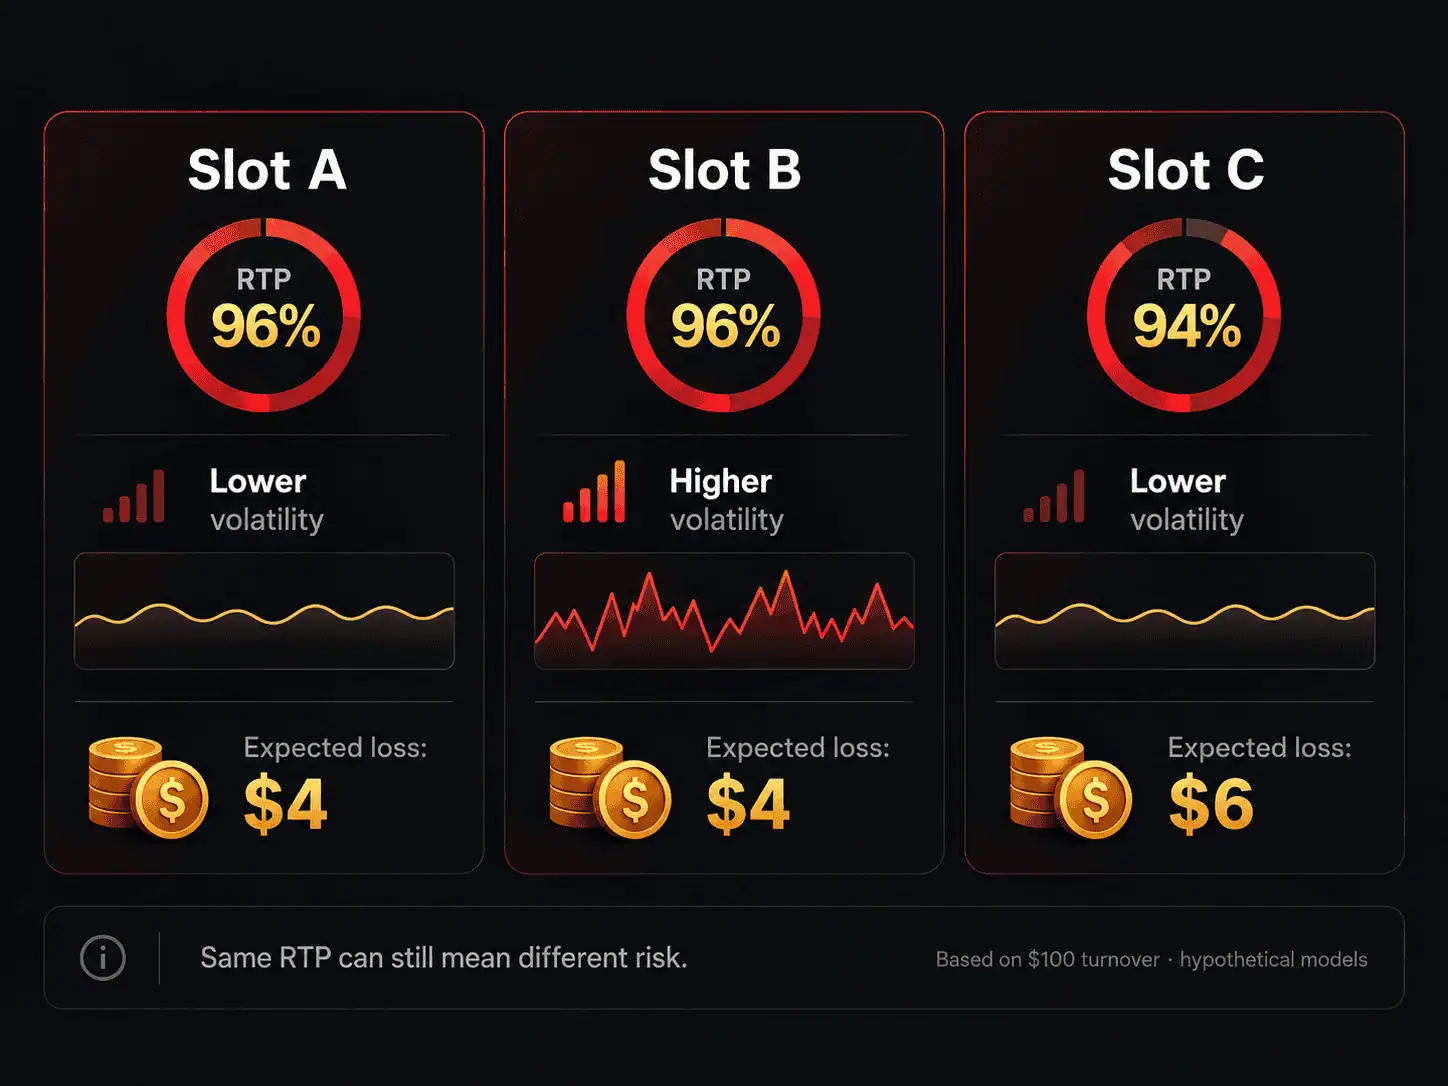
In all three models, turnover remains $100. The expected losses are $4 for Slot A, $4 for Slot B and $6 for Slot C.
We can also calculate the standard deviation of each model’s payout per $1 spin: approximately $1.44 for A, $8.60 for B and $1.40 for C. This confirms the much wider payout spread in B.
The central lesson is that expected cost and payout dispersion are different dimensions of risk. A player needs both to understand why a high-RTP game may still produce severe short-term losses.
Why High RTP Does Not Guarantee Low Bankroll Risk
A higher RTP means a lower theoretical loss over the same amount of wagering, assuming an otherwise comparable game. It does not guarantee that a limited balance can withstand a high-volatility payout pattern.
Suppose someone allocates $30 as a firm entertainment limit. On a $1 spin, 30 consecutive zero payouts would exhaust that entire amount. Such a streak is possible even in a game whose advertised RTP appears favourable.
There is no universal minimum bankroll that makes high-volatility slots safe. To estimate the probability of running out of funds, you would need the full payout distribution, starting balance, stake, and rules for when play stops. An RTP figure and a vague volatility label cannot supply that answer.
Stake Size and Speed Add Another Layer of Exposure
At 96% RTP, 100 spins at $1 produce $100 in turnover and $4 in expected loss. Raise the stake to $2 and the turnover doubles to $200, producing $8 in expected loss.
Similarly, faster rounds can generate more turnover within the same amount of time.
For the full relationship, see the relationship between RTP and house edge.
Low Volatility Does Not Make a Losing Game Profitable
A 94% RTP slot retains a theoretical 6% house edge regardless of how often small payouts appear. At $1,000 in turnover, its expected loss is $60. A 96% RTP game would have an expected loss of $40 over that same turnover.
Yet the 94% game might produce a better result in a particular short session. That possibility does not change which game has the higher theoretical return.
Repeatedly recycling small prizes can also make a session appear longer or less costly than it is. A player might start with $100, keep wagering partial returns and eventually accumulate $500 in turnover. At 94% RTP, that fixed turnover carries $30 in expected loss—not merely 6% of the original deposit.
Neither low volatility nor a high hit frequency creates an advantage over a negative house edge.
How to Compare Two Slots Responsibly
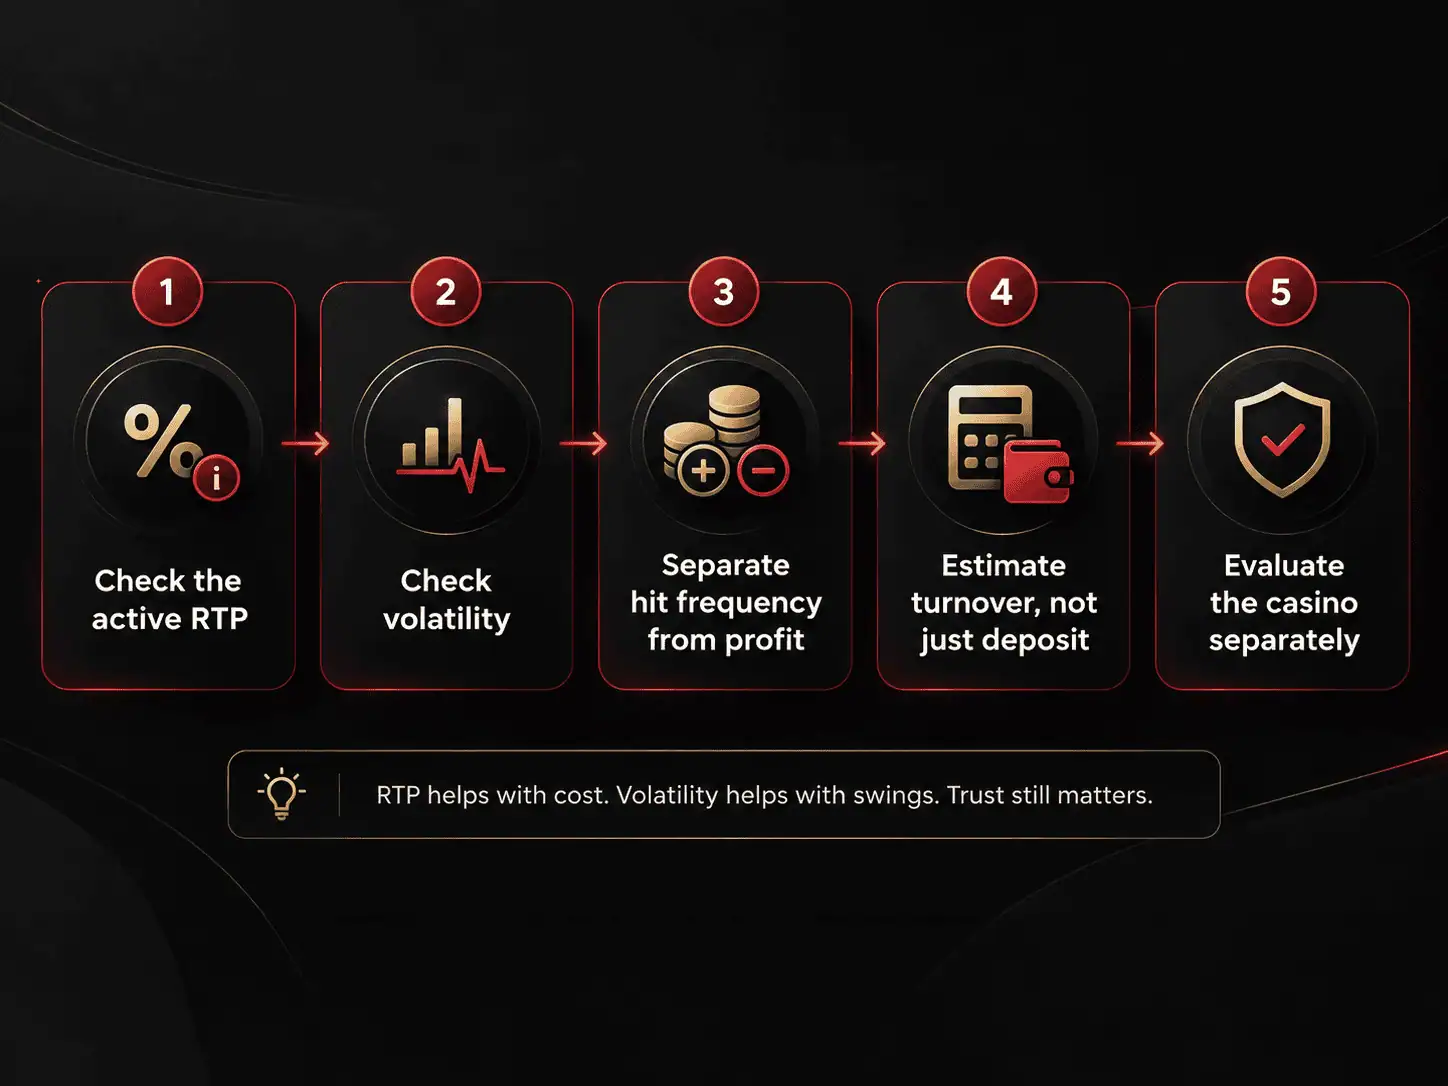
1. Check the RTP of the Version Actually Offered
Open the game rules or information panel and look for the active return percentage. Some titles are available in more than one approved configuration. Therefore, a review or demo may display a percentage that differs from the real-money version at a particular casino.
Our guide explains why one slot may have several RTP versions and how to check the active figure.
2. Look for the Provider’s Own Volatility Information
Check the game’s official documentation when available. If you see only a star rating, find out what the provider means by it. Do not assume another studio uses the same scale. If the formal figure is unavailable, say so rather than treating a third-party estimate as verified.
3. Separate Hit Frequency From Profitable Outcomes
Ask whether the advertised frequency includes payouts below the stake. If it does, regular hits can coexist with ongoing net losses. Also, check whether a statistic describes all payouts or only a particular bonus feature.
4. Estimate Turnover Rather Than Guessing From a Deposit
For example, 150 spins at $0.50 create $75 in turnover. At 96% RTP, their theoretical expected loss is $3. At 94%, it is $4.50. Those numbers are not safe-loss limits, and a player may run out of money before completing the planned spins.
5. Evaluate the Casino Separately From Its Games
A slot’s RTP says nothing about the operator’s withdrawal checks, account restrictions, ownership, or bonus conditions. Game mathematics and casino reliability are separate issues. CasinoIndex covers why RTP alone does not make a casino reliable.
If you also need the basic structure of reels, paylines and features, read the wider mechanics behind online slots.
Why Your Session RTP Can Look Nothing Like the Published Number
If you wager $100 and receive $35 in total payouts, your observed RTP for that particular sample is 35%. It does not follow that the game’s underlying theoretical RTP is 35%.
The UK Gambling Commission’s RTP monitoring guidance explains that acceptable differences between theoretical and observed RTP depend partly on volatility and sample size. Its example compares a game designed at 91.68% RTP with an observed return of 90.42% over a measurement period.
Likewise, Gaming Laboratories International describes mathematical and simulated evaluation of RTP, including base games, features, jackpots and volatility.
In practice, there is no fixed number of spins that guarantees your personal results will match the theoretical RTP. Playing longer does not make previous losses recoverable or create an obligation for the game to pay you back.
Frequently Asked Questions
What Is the Difference Between RTP and Volatility in Slots?
RTP describes the theoretical percentage returned from total wagers over the long run. Volatility describes the spread of possible payouts around that average. RTP informs expected loss; volatility helps explain how sharply short-session results can fluctuate.
Are High-RTP, Low-Volatility Slots Safer?
Not necessarily. A higher RTP reduces theoretical expected loss over equal turnover, while lower volatility usually means a more concentrated payout distribution. Neither prevents a losing streak, guarantees a winning session, or proves a casino is trustworthy.
Does High Volatility Always Mean a Higher Maximum Win?
No. High volatility often involves a wider range of prizes, but maximum win and the probability of reaching it depend on the actual game rules and mathematical model.
Is Slot Volatility the Same as Variance?
They are closely related, but not strictly identical. Variance is the mean squared deviation of outcomes from the expected result. Standard deviation is its square root and is commonly used as a numerical volatility measure.
Can Hit Frequency Tell Me How Often I Will Profit?
No. Hit frequency commonly counts qualifying payouts, including returns below the amount staked. A $0.50 payout on a $1 spin is a hit under many definitions, but still a $0.50 loss.
Can RTP or Volatility Predict the Next Winning Spin?
No. In a correctly functioning game with independent outcomes, earlier spins do not make a particular result due. Neither RTP nor volatility predicts the next outcome or guarantees that losses will be recovered.
Why Can Two Casinos Display Different RTP Figures for the Same Slot?
Some developers offer different approved RTP configurations of one title. Casino operators may select among those versions where permitted. Always check the game information for the version being offered rather than assuming the same title uses the same percentage everywhere.
Final Takeaway: Compare Expected Cost and Payout Swings Separately
RTP and volatility explain different parts of slot mathematics. RTP tells you the theoretical return on total wagering. Volatility explains the spread of possible payouts around that number.
Our three models make the distinction concrete. Two 96% RTP games had identical $4 expected losses on $100 turnover, but very different payout distributions. The lower-volatility 94% model had a higher expected loss of $6.
These figures can improve your understanding of gambling risk. They cannot identify a winning session, remove the house edge or make gambling a reliable way to earn money. If you choose to play, use only an amount you can afford to lose and set spending and time limits in advance.

Nina Kanu has worked in cryptocurrency content and blockchain research since 2016. She is also known within parts of the crypto community through CryptoMutant, where her work has covered emerging projects, market trends and developments across the blockchain ecosystem. At CasinoIndex, Nina focuses on crypto casino reviews, platform comparisons, player experience, game ecosystems and bonus fairness. Her research examines how casino products perform beyond their marketing, including usability, payment options, promotional terms and the overall experience players receive after signing up.